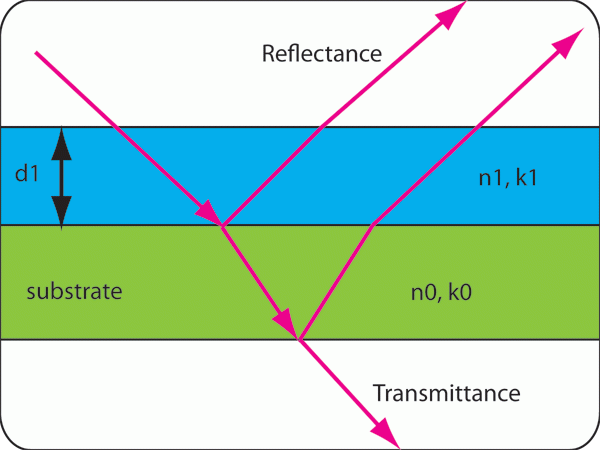
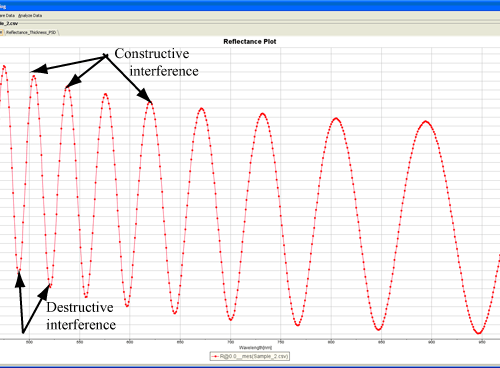
Our systems measure light reflected and/or transmitted from a layer structure over a specified wavelength range. Light reflected from different interfaces can be in or out of phase, producing constructive (adding) or destructive (subtracting) interference, which causes intensity oscillations that are characteristic of the thin-film structure.
An indirect measurement
Like other optical methods, spectroscopic reflectance is indirect: the data must be analyzed to determine filmstack parameters such as thickness, optical constants and surface roughness. Two complementary approaches are used.
- Curve fitting. The software calculates the theoretical reflectance of the stack and adjusts parameters until it best matches the measured data; the filmstack parameters are inferred from that best fit. This is typically used for thin layers, or when optical constants and/or surface roughness need to be determined.
- Fourier-transform (FFT) based. This method is used to determine the thickness of thick layers (> 2 µm).
Reading the spectrum
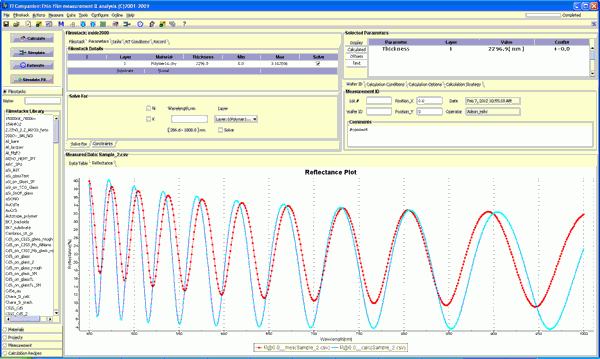
Interpretation of reflection data is intuitive, especially for relatively thick films. Thickness information lives primarily in the frequency of the reflectance oscillations, while optical-constant information, more precisely the optical contrast between interfaces, lives in the amplitude of those oscillations.
When thickness alone is fit with an incorrect refractive index, the oscillation period can match while the amplitude does not. To determine thickness more accurately, thickness and refractive index are fit together. In this example, refractive index is represented with a Cauchy approximation, which works well for polymer materials in the visible and NIR range. Other approximations, such as Tauc-Lorentz, Drude, Exciton and effective-media models, are used depending on the material.
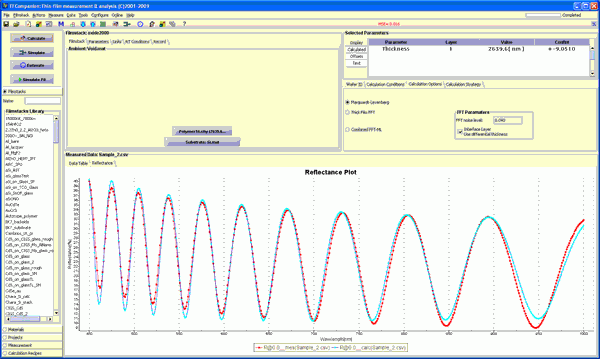
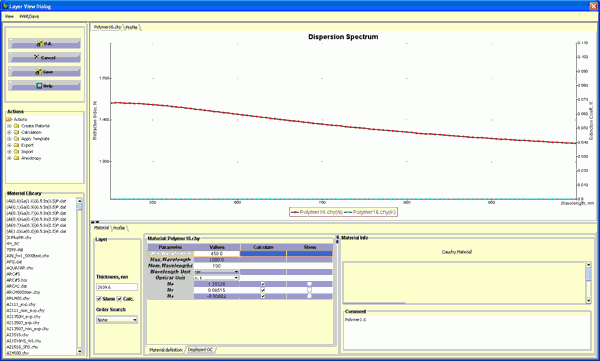
A useful corollary: refractive index can be measured very accurately when the substrate's refractive index is known.
Why FFT for thick films
Curve fitting is powerful but not always suitable. Real films often carry artifacts such as coloring, non-uniformity and residual absorption that are of no interest, yet must be accounted for to fit correctly. This is especially true for thick films (> 2 µm). The FFT method determines thickness from the oscillation frequency while ignoring other properties, although optical constants still must be supplied for correct results.
- High measurement speed
- Low sensitivity to changes in the probe-to-sample distance
- Minimal need for calibration
Together these make FFT the preferred method for inline measurement in a manufacturing environment.
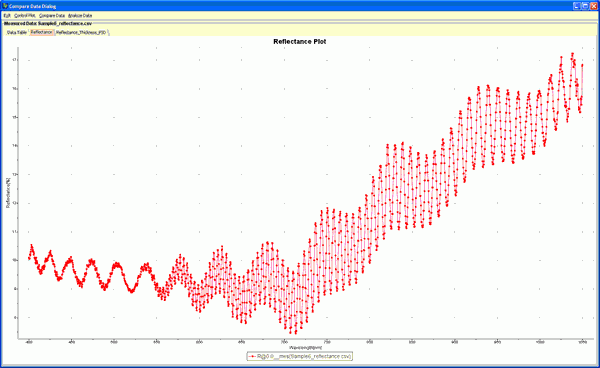
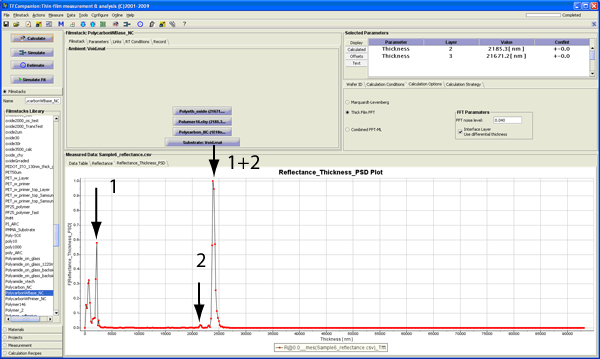
Reflectance spectra of the polymer film on a thick polymer substrate are shown in Fig. 6. Two oscillation frequencies corresponding to two layers are clearly visible. Results of the FFT analysis are shown in Fig. 7. Since there are two layers, three peaks appear: total thickness (layer 1 + layer 2), layer 1 and layer 2. The total-thickness peak is strong because polymer/air optical contrast is good; the layer 1 peak is weaker because of scattering and non-uniformity in the material, but total thickness and top-layer thickness make it possible to confirm the substrate thickness.
Down to a single monolayer
Interference fringes appear only in the reflectance spectra of relatively thick films, typically at least > 100 nm. Very thin films show no fringes at all, yet curve fitting can still determine their thickness.
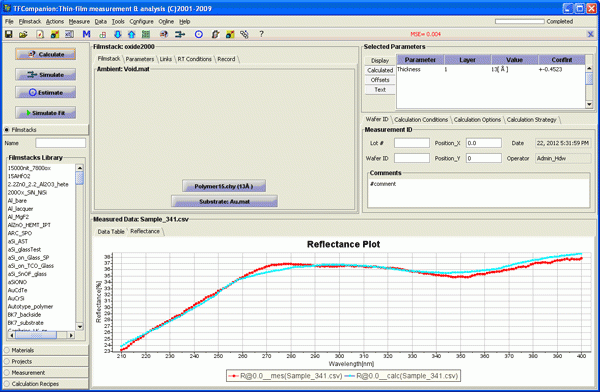
In practice, a single monolayer polymer film has been measured this way, readily demonstrating sub-1 nm sensitivity with spectroscopic reflectance.
What we can measure
Practically any translucent coating or film can be measured. Because MProbe systems span UV to IR, we select a transparency window within that range, so even materials that look opaque to the eye can be measured in another band. Thin-film solar absorbers (CIGS, CdTe) are designed to absorb visible light, yet their thickness measures cleanly in the NIR (900–1700 nm). See rough surfaces and solar absorbers for how spot size and wavelength are chosen.
- Thickness range - material dependent, generally 1 nm to 1 mm. Optical constants can be measured for thicknesses > 200 nm (thinner for absorbing materials). Range depends on wavelength range, spectrometer resolution and material refractive index.
- Number of layers - no hard limit. Up to 5 layers are typically measured accurately; precision decreases as the count rises. Optical coatings such as interference filters and heterostructures can have hundreds of layers, handled as linked layers so they are not treated independently.
- Substrate - by definition, infinitely thick (no light returns from its back interface). A silicon wafer is a substrate in the visible; a thin polymer or 1 mm glass is treated as a special layer with backside reflectance accounted for.
- Metal layers - very thin metal layers, typically < 50 nm, can be measured; thicker layers are opaque to the optical technique.
- Surface roughness - its effect grows sharply at shorter wavelengths, so NIR helps. Films with roughness < 30 nm are measurable with a Visible system and < 70 nm with NIR, and the roughness itself can be determined.
Building the filmstack model
Because the measurement is indirect, determining layer parameters requires a model of the filmstack: the number and type of layers and nominal thicknesses. If material properties are unknown, start from a similar known material; knowing the material class, such as dielectric or conducting polymer, is often enough to build a working model. The more that is known, the easier it is to build a correct model. Many typical filmstacks ship in the database, along with 500+ materials and a wide range of parameterized material types; new materials can be imported or created.